Moving Volatility Channel Strategy
Basic Overview
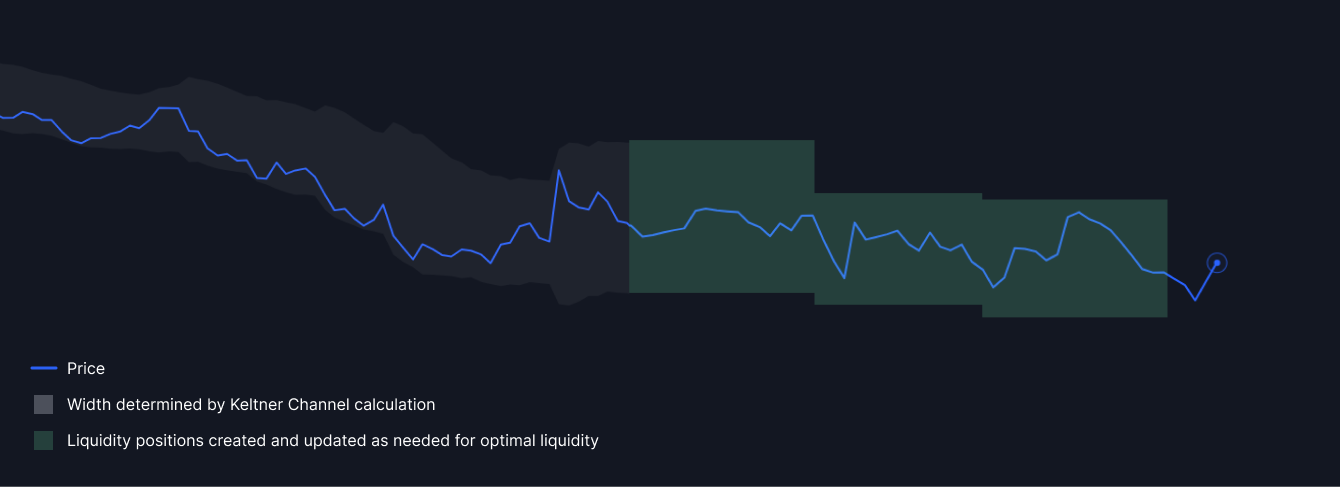
The Moving Volatility Channel Strategy is an advanced market making solution that leverages the Keltner Channel concept. It excels in trending market conditions across various asset classes, using moving averages as a focal point for position management. This strategy's distinctive feature is its method of determining channel width based on the average volatility of candle sizes within a given period, allowing it to adapt to a broad spectrum of market dynamics.
Ideal Applications

In some instances this strategy can be effective in higher volatitliy token pairings when configured appropriately.
This strategy requires candle data to operate, ensure there is a reliable data source for the candles for proper execution.
Advanced Description and Uses
Strategy Details
The Moving Volatility Channel Strategy operates by:
- Utilizing moving averages as a basis for position management
- Calculating channel width based on average candle volatility
- Applying a customizable multiplier to adjust channel boundaries
- Dynamically adjusting positions in response to market trends and volatility
Key Features
- Adaptive Channel Width
- Trend-Focused Positioning
- Responsive Adjustment Mechanism
- Flexibility in Volatility Management
This strategy has rebalance trigger support and liquidity curve support.
Strategic Advantages
- Enhanced Trend Capture for more aggressive market making
- Tailored approach to both low and high volatility scenarios
- Minimized Risk Exposure
- Real-time adjustment to positions
Technical Explanation
The Moving Volatility Channel Strategy uses Keltner Channels, which are volatility-based bands placed on both sides of an asset's price to determine trend direction and manage positions.
Core Mechanics
Channel Calculation: The Keltner Channel is calculated using the following components:
- Interval: Time period for the moving average (e.g., 10 days)
- Deviation Multiplier: Determines how far the bands should be from the average
- Exponential Moving Average (EMA): Calculated as:Where p is the previous price and x is the previous EMA
EMA = p * (deviation/(1 + interval)) + x * (1 - multiplier/(1 + interval)) - Average True Range (ATR): A volatility indicator showing average asset movement
Channel Boundaries: The upper and lower bands are calculated as:
Upper Band = EMA + (ATR * multiplier)
Lower Band = EMA - (ATR * multiplier)
ATR Calculation: For a given interval, ATR is the greatest of:
- Current high minus the previous close
- Current low minus the previous close
- Current high minus the current low
Position Management: The strategy uses these channel boundaries to guide liquidity provision decisions, adjusting positions based on price movements relative to the channel.
Volatility Adaptation: The channel width adapts to market volatility by incorporating the ATR, allowing the strategy to perform in both low and high volatility environments.
Implementation Considerations
- The choice of interval and deviation multiplier can significantly impact the strategy's performance and should be carefully calibrated based on the specific asset and market conditions.
- While effective in trending markets, the strategy may underperform in ranging or highly volatile markets with frequent trend reversals.
- Regular monitoring and adjustment of parameters may be necessary to maintain optimal performance across different market phases.
- As with all trading strategies, thorough backtesting and risk management practices should be employed before live implementation.
By offering this level of trend capture and volatility adaptation, the Moving Volatility Channel Strategy enables liquidity providers to create sophisticated approaches that can effectively respond to various market trends and volatility levels while managing risk.